

Log traces during model training runs
Use Weave Panels
By decorating the functions with@weave.op in your ML-pipelines, you automatically capture their execution information and access it in a personal workspace.
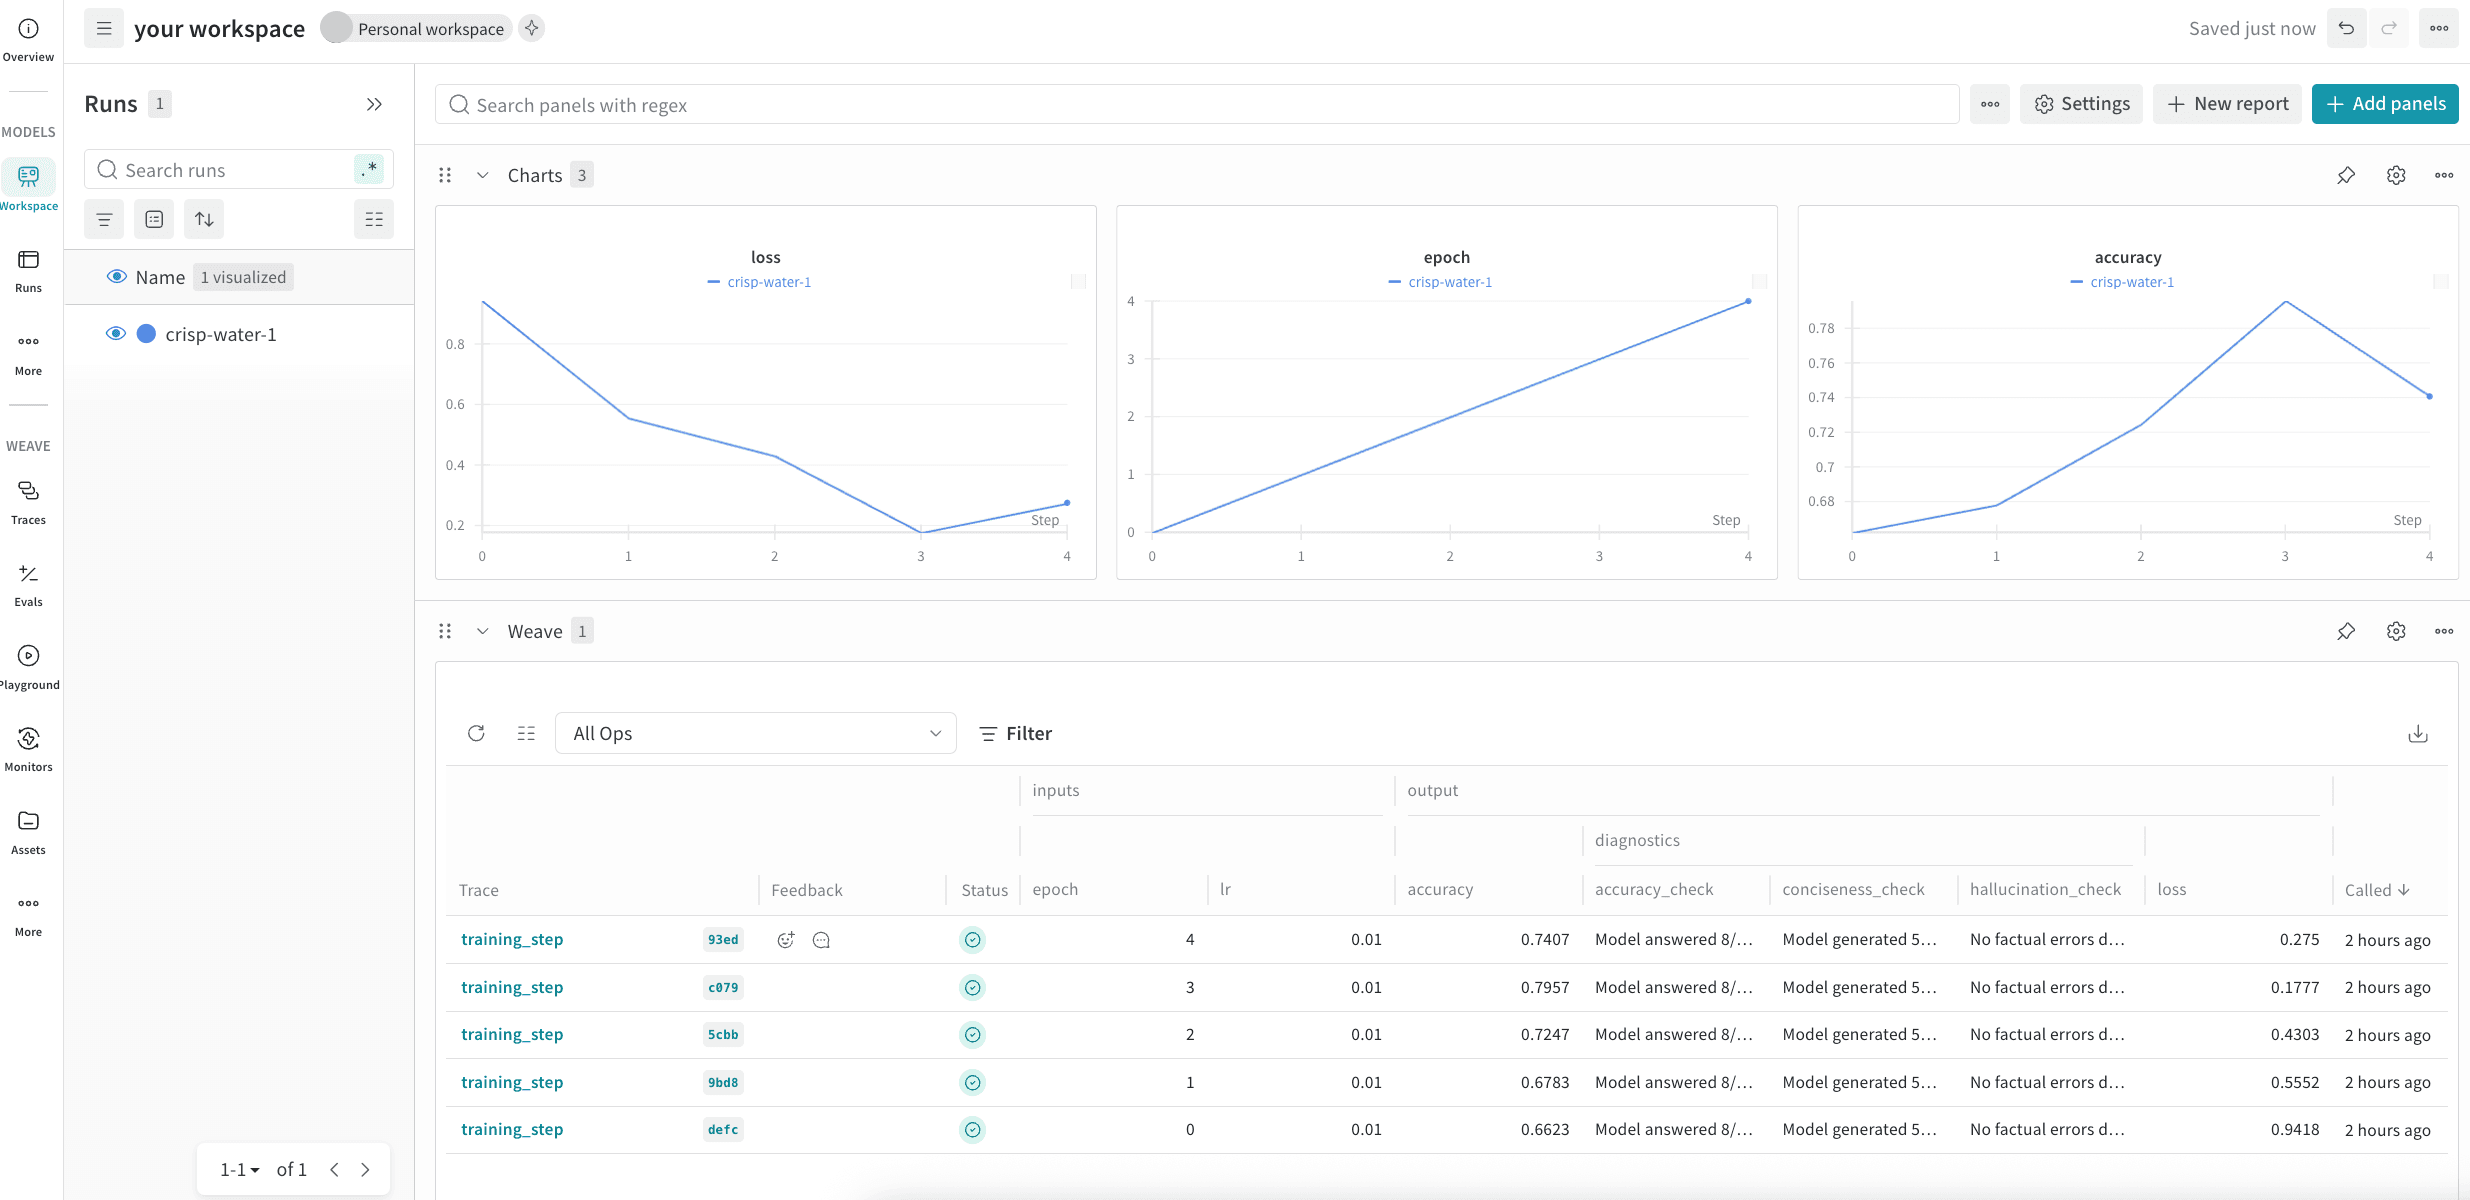
For example, the following script demonstrates how Weave traces integrate with W&B training runs. It simulates a machine learning training loop where each training step logs metrics to W&B while simultaneously creating detailed Weave traces. The @weave.op decorators on the functions automatically capture inputs, outputs, and execution details. When the training loop logs metrics with wandb.log(), it also logs Weave trace information to your project.
wandb: 🚀 View run at https://wandb.ai/wandb/my-project/runs/<run-ID>) or navigate to the workspace in the UI.
To navigate to a workspace from the UI:
- Open the W&B UI and click the Projects tab. This opens a list of your projects.
- From the list of projects, click the project that you logged your run to. This opens the Workspaces page.
- If you’ve set up your workspace as an automatic workspace, the workspace automatically populates with data visualizations and information about your run. The trace data for your run is under the Weave section of the workspace. If your workspace is a manual workspace, you can add Weave panels to by clicking Add panels and selecting new panels from the Weave section of the Add Panels menu.
Associate traces with a specific W&B run
By default, Weave automatically detects and associates traces with the activewandb.run. If you need to associate traces with a specific run that is not the global wandb.run, use set_wandb_run_context. You can associate traces with a specific run and run step by defining values for the method’s run_id and step arguments:
run_id is the run’s short ID (for example, 38m4t5ja), not the full entity/project/run_id path. You can find a run’s short ID in the run URL (https://wandb.ai/team/project/runs/<run_id>) or by accessing wandb.run.id in code.
To stop the override and fall back to the global wandb.run, call clear_wandb_run_context:
Reference W&B artifacts in a Weave trace
You can reference W&B artifacts (such as models, datasets, and checkpoints) in your Weave traces. This creates a clickable link in the Weave UI that navigates directly to the artifact’s details page, helping you track which artifact versions were used during specific operations. For example, if you’ve trained two versions of a model (v1 and v2), you can add the v1 artifact reference as an attribute of the trace when you query that model. This helps you trace exactly which artifact version produced a given output.
To associate an artifact with a trace, construct the artifact’s URL by concatenating the wandb-artifact:/// prefix with the artifact’s full name using the following syntax: wandb-artifact:///<full-name-of-artifact>. Then pass it to Weave in one of two ways:
- As an arbitrary attribute
- As an attribute of a
Model
<entity>/<project>/<artifact_name>:<version>. You can copy the full name from the artifact’s details page in the W&B UI.
Add it as an attribute of a trace
To add an artifact as an attribute of a trace, pass it as a key-value pair to theweave.attributes() context manager:
- Python
- TypeScript
Add an artifact as an attribute of a Model
To add an artifact as an attribute of a Model, pass the artifact URL when you instantiate the model:
The
Model class is currently only supported in the Weave Python SDK.