> ## Documentation Index
> Fetch the complete documentation index at: https://wb-21fd5541-docs-1917.mintlify.site/llms.txt
> Use this file to discover all available pages before exploring further.
> 메트릭을 시각화하고, 축을 사용자 지정하며, 범주형 데이터를 막대로 비교합니다.
# 막대 플롯
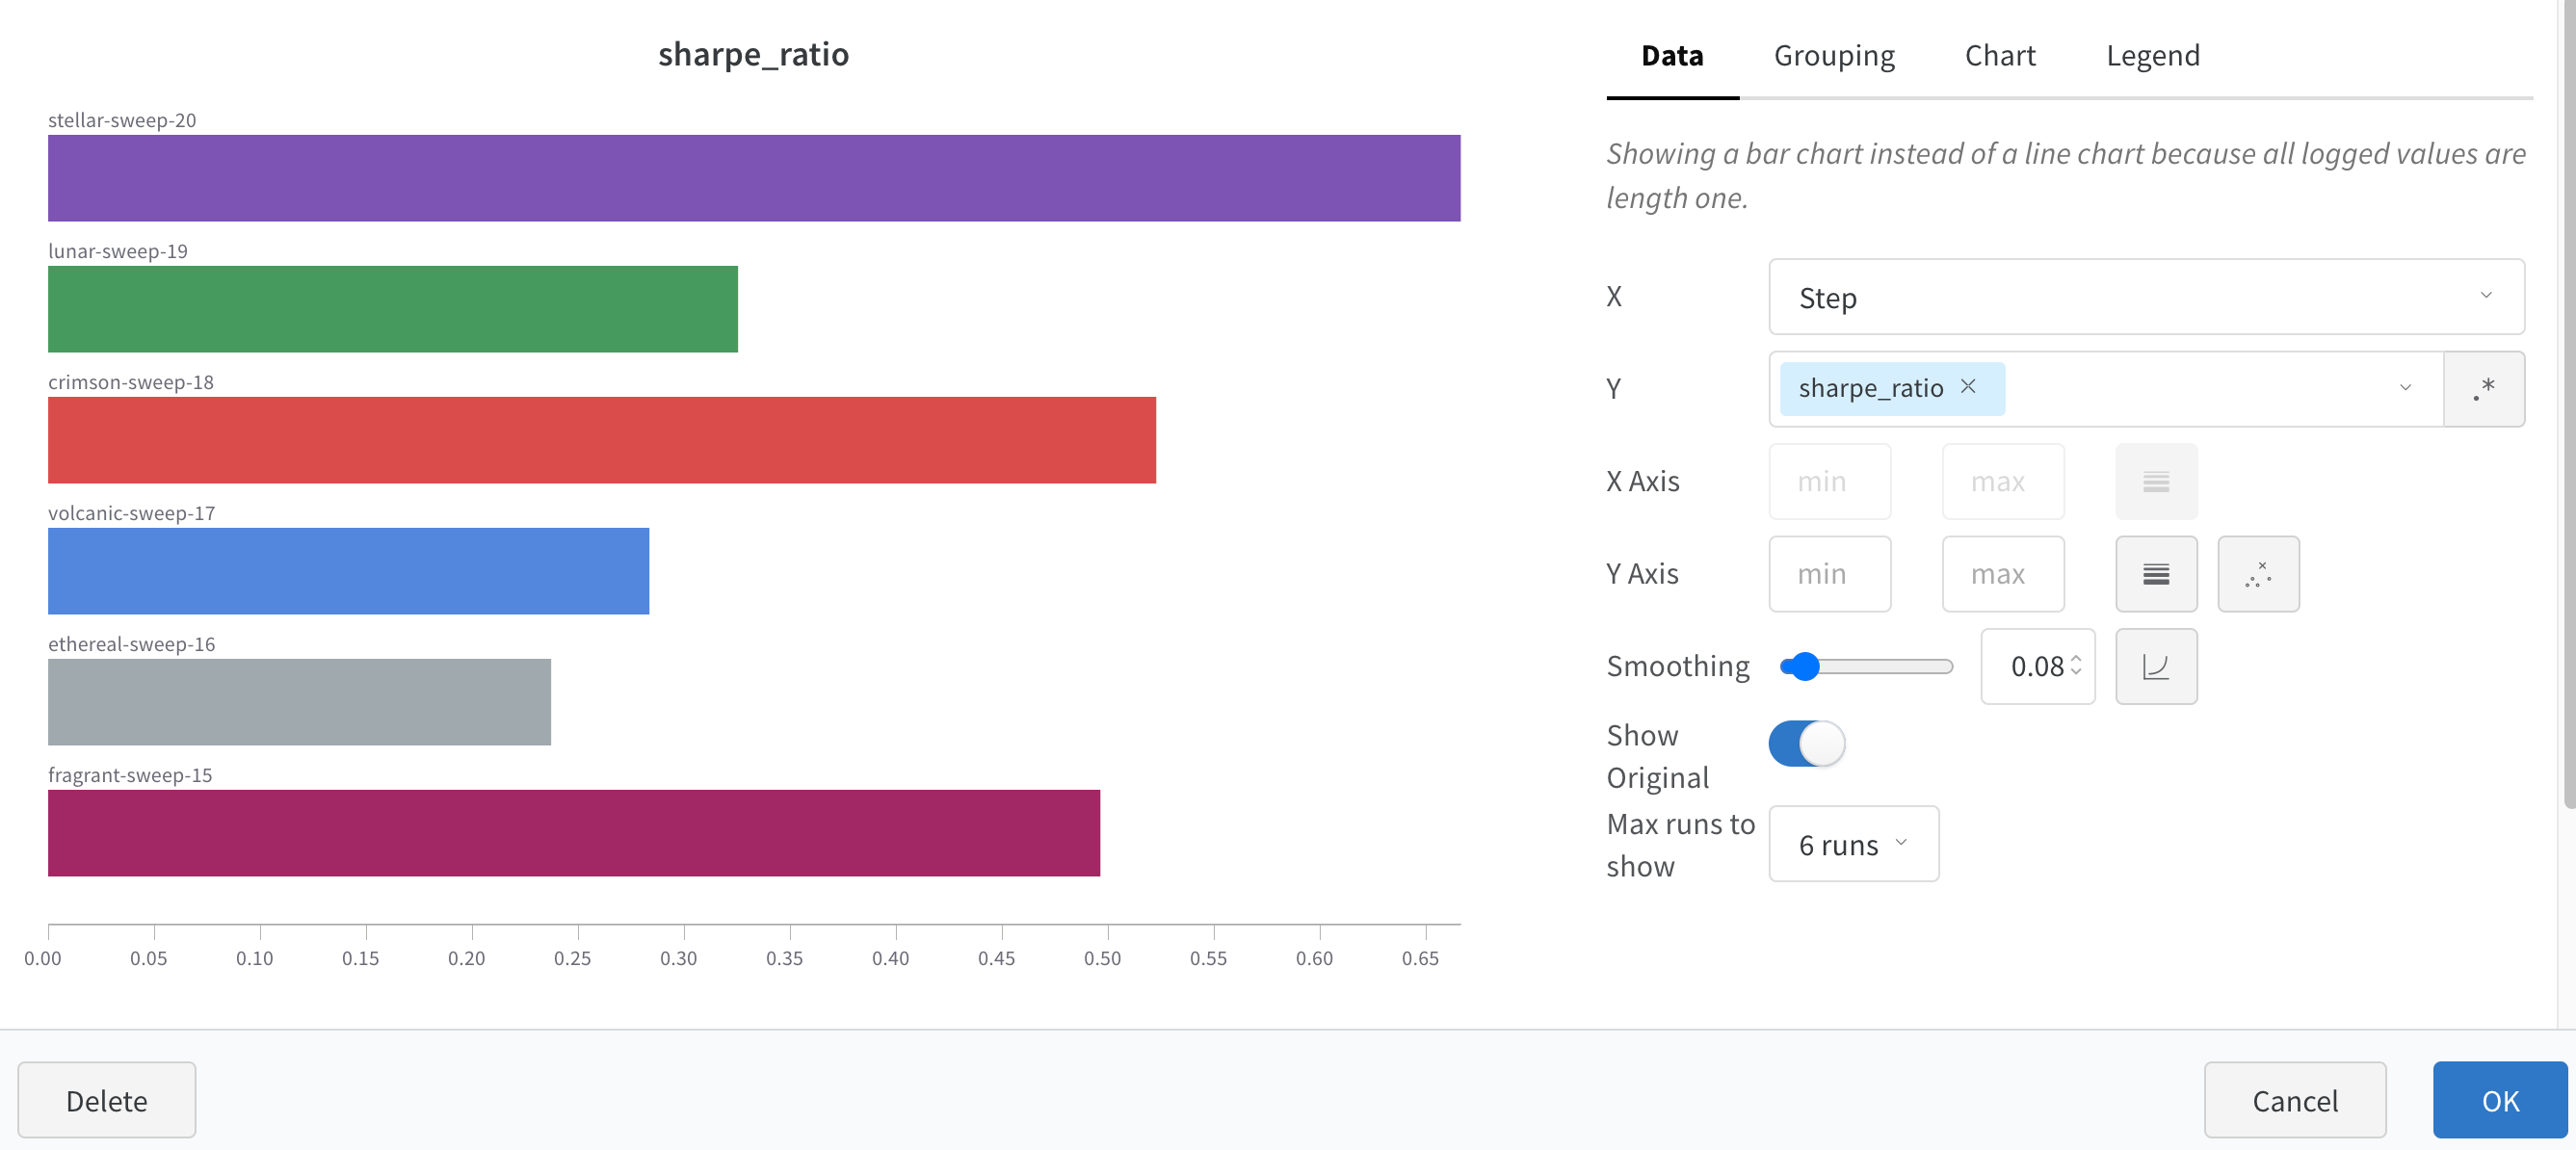
막대 플롯은 직사각형 막대로 범주형 데이터를 나타내며, 막대를 세로 또는 가로로 그릴 수 있습니다. 로깅된 모든 값의 길이가 1이면 `wandb.Run.log()`에서 기본적으로 막대 플롯이 표시됩니다.
차트 설정에서 표시할 최대 run 수를 제한하고, 임의의 설정을 기준으로 run을 그룹화하고, 레이블 이름을 바꿀 수 있습니다.
## 막대 플롯 사용자 지정
**Box** 또는 **Violin** 플롯을 만들어 여러 요약 통계량을 하나의 차트 유형으로 결합할 수도 있습니다.
1. Runs table에서 run을 그룹화합니다.
2. Workspace에서 'Add panel'을 클릭합니다.
3. 표준 'Bar Chart'를 추가하고 플롯할 메트릭을 선택합니다.
4. 'Grouping' 탭에서 'box plot' 또는 'Violin' 등을 선택해 해당 스타일로 플롯합니다.
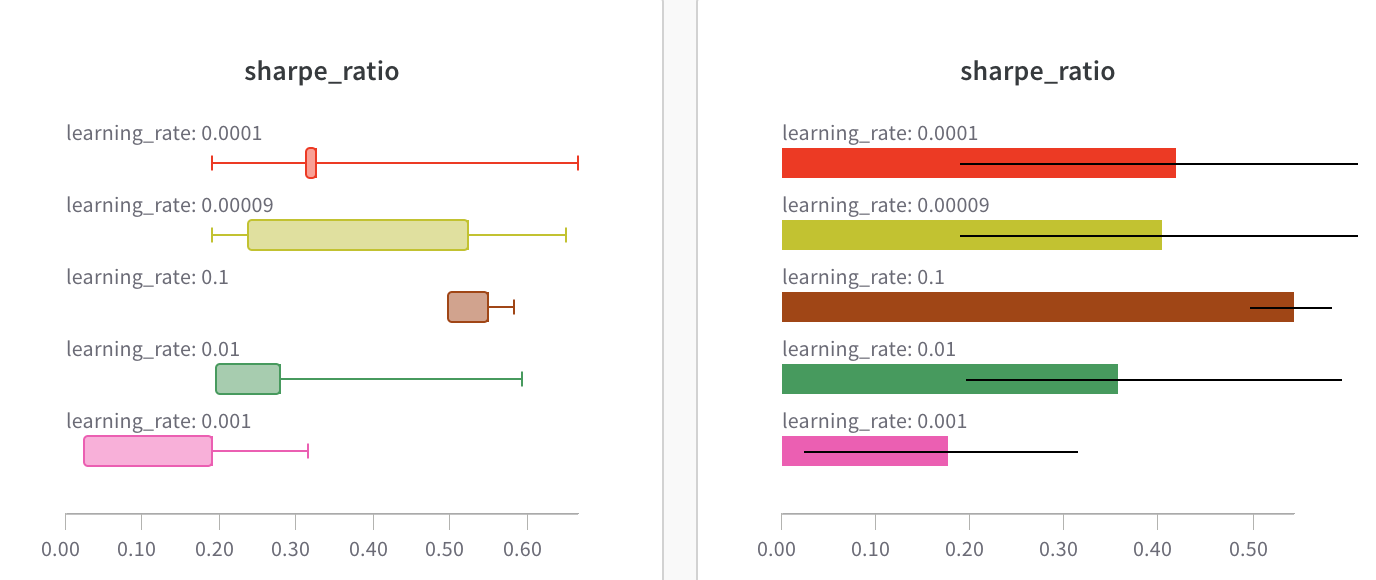 차트 설정에서 표시할 최대 run 수를 제한하고, 임의의 설정을 기준으로 run을 그룹화하고, 레이블 이름을 바꿀 수 있습니다.