> ## Documentation Index
> Fetch the complete documentation index at: https://wb-21fd5541-docs-1917.mintlify.site/llms.txt
> Use this file to discover all available pages before exploring further.
# PyTorch Geometric
> PyTorch Geometric を W&B と統合して、幾何学的深層学習におけるグラフの可視化と実験管理を行います。
[PyTorch Geometric](https://github.com/pyg-team/pytorch_geometric) (PyG) は、幾何学的深層学習向けのライブラリとして特に人気が高く、W\&B とはグラフの可視化や実験のトラッキングで非常に相性よく利用できます。
PyTorch Geometric をインストールしたら、使い始めるには次の step に従ってください。
## サインアップしてAPIキーを発行する
APIキーを使用すると、お使いのマシンをW\&Bで認証できます。APIキーはユーザープロフィールから発行できます。
より手早く行うには、[User Settings](https://wandb.ai/settings) に直接アクセスしてAPIキーを作成してください。新しく作成したAPIキーはすぐにコピーし、パスワードマネージャーなどの安全な場所に保存してください。
1. 右上にあるユーザープロフィールアイコンをクリックします。
2. **ユーザー設定**を選択し、**API Keys** セクションまでスクロールします。
## `wandb` ライブラリをインストールしてログインする
`wandb` ライブラリをローカルにインストールしてログインするには、次の手順を実行します。
1. `WANDB_API_KEY` [環境変数](/ja/models/track/environment-variables/) に APIキー を設定します。
```bash theme={null}
export WANDB_API_KEY=
```
2. `wandb` ライブラリをインストールし、ログインします。
```shell theme={null}
pip install wandb
wandb login
```
```bash theme={null}
pip install wandb
```
```python theme={null}
import wandb
wandb.login()
```
```notebook theme={null}
!pip install wandb
import wandb
wandb.login()
```
## グラフを可視化する
エッジ数やノード数など、入力グラフに関する詳細を保存できます。W\&B は Plotly チャートと HTML パネルのログをサポートしているため、グラフ用に作成した可視化も W\&B にログできます。
### PyVis を使用する
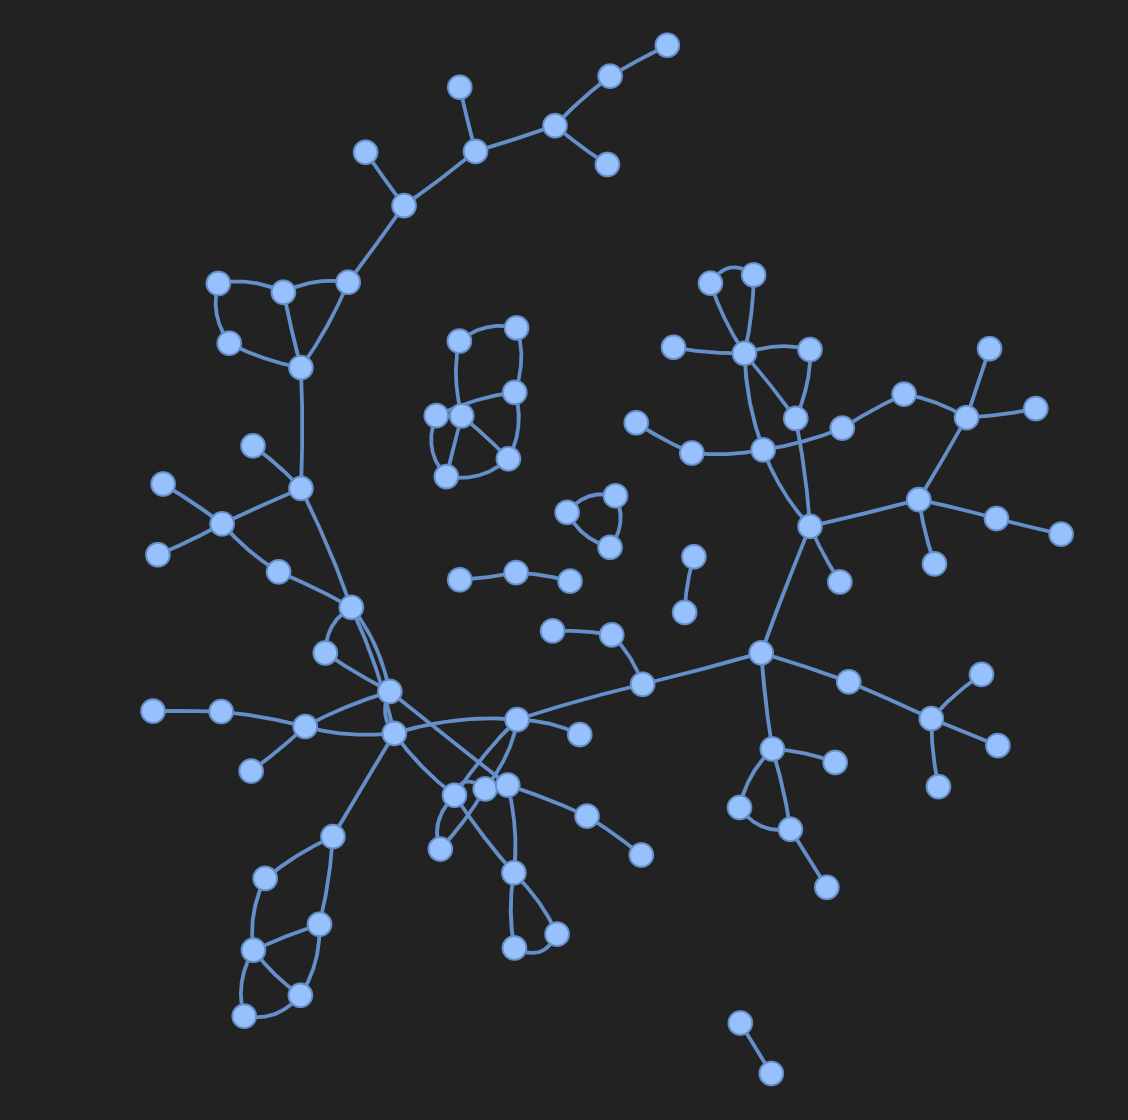
次のスニペットは、PyVis と HTML を使ってこれを実現する方法を示しています。
```python theme={null}
from pyvis.network import Network
import wandb
with wandb.init(project=’graph_vis’) as run:
net = Network(height="750px", width="100%", bgcolor="#222222", font_color="white")
# PyGグラフのエッジをPyVisネットワークに追加する
for e in tqdm(g.edge_index.T):
src = e[0].item()
dst = e[1].item()
net.add_node(dst)
net.add_node(src)
net.add_edge(src, dst, value=0.1)
# PyVisの可視化をHTMLファイルに保存する
net.show("graph.html")
run.log({"eda/graph": wandb.Html("graph.html")})
```
### Plotlyを使用する
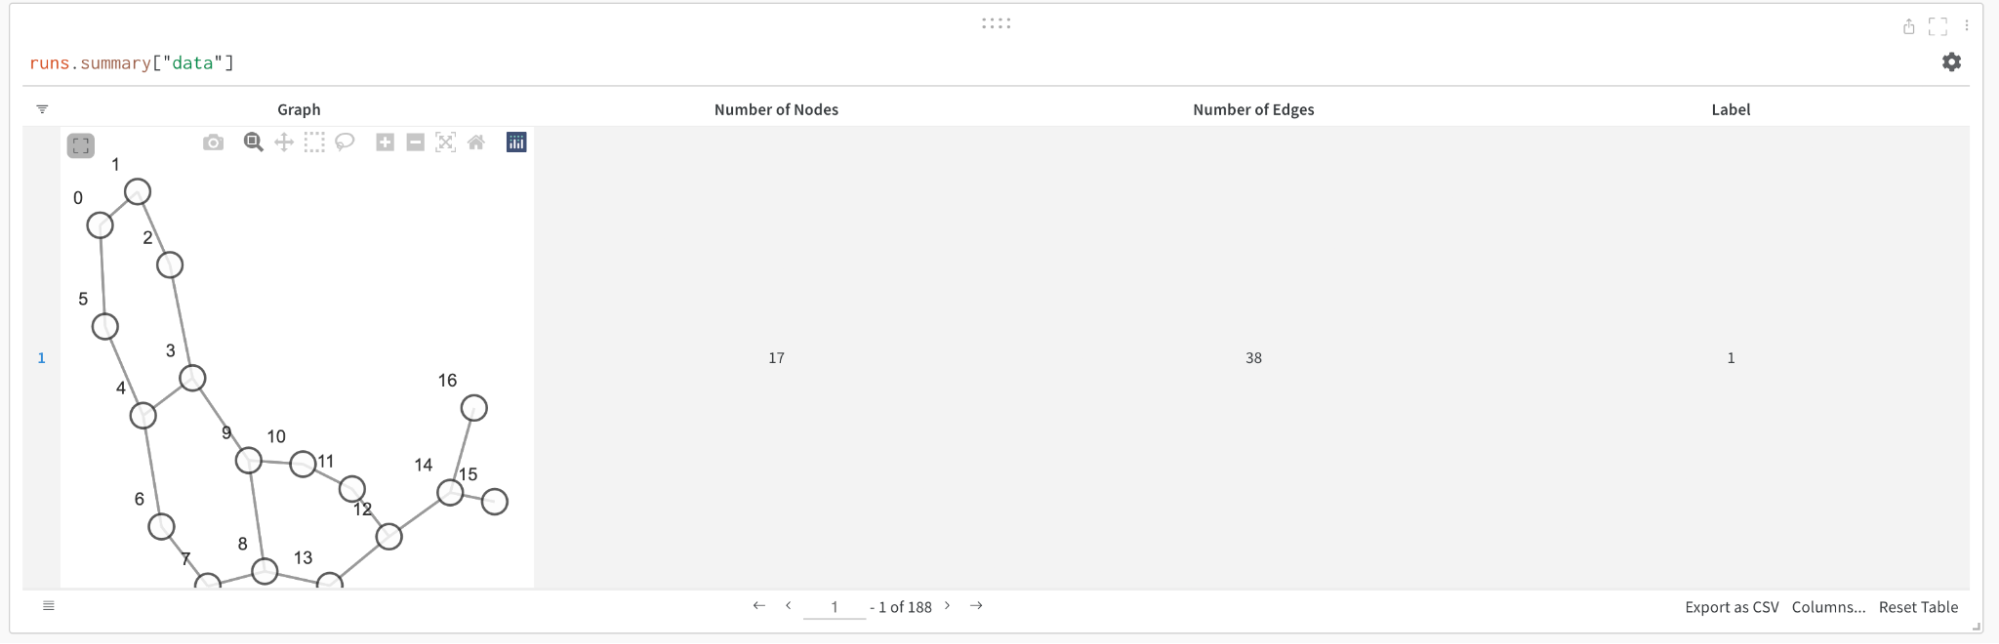
Plotlyを使用してグラフの可視化を作成するには、まず PyG グラフを networkx オブジェクトに変換する必要があります。次に、ノードとエッジの両方について Plotly の scatter プロットを作成する必要があります。以下のスニペットをこの作業に使用できます。
```python theme={null}
def create_vis(graph):
G = to_networkx(graph)
pos = nx.spring_layout(G)
edge_x = []
edge_y = []
for edge in G.edges():
x0, y0 = pos[edge[0]]
x1, y1 = pos[edge[1]]
edge_x.append(x0)
edge_x.append(x1)
edge_x.append(None)
edge_y.append(y0)
edge_y.append(y1)
edge_y.append(None)
edge_trace = go.Scatter(
x=edge_x, y=edge_y,
line=dict(width=0.5, color='#888'),
hoverinfo='none',
mode='lines'
)
node_x = []
node_y = []
for node in G.nodes():
x, y = pos[node]
node_x.append(x)
node_y.append(y)
node_trace = go.Scatter(
x=node_x, y=node_y,
mode='markers',
hoverinfo='text',
line_width=2
)
fig = go.Figure(data=[edge_trace, node_trace], layout=go.Layout())
return fig
with wandb.init(project=’visualize_graph’) as run:
run.log({‘graph’: wandb.Plotly(create_vis(graph))})
```
## メトリクスをログする
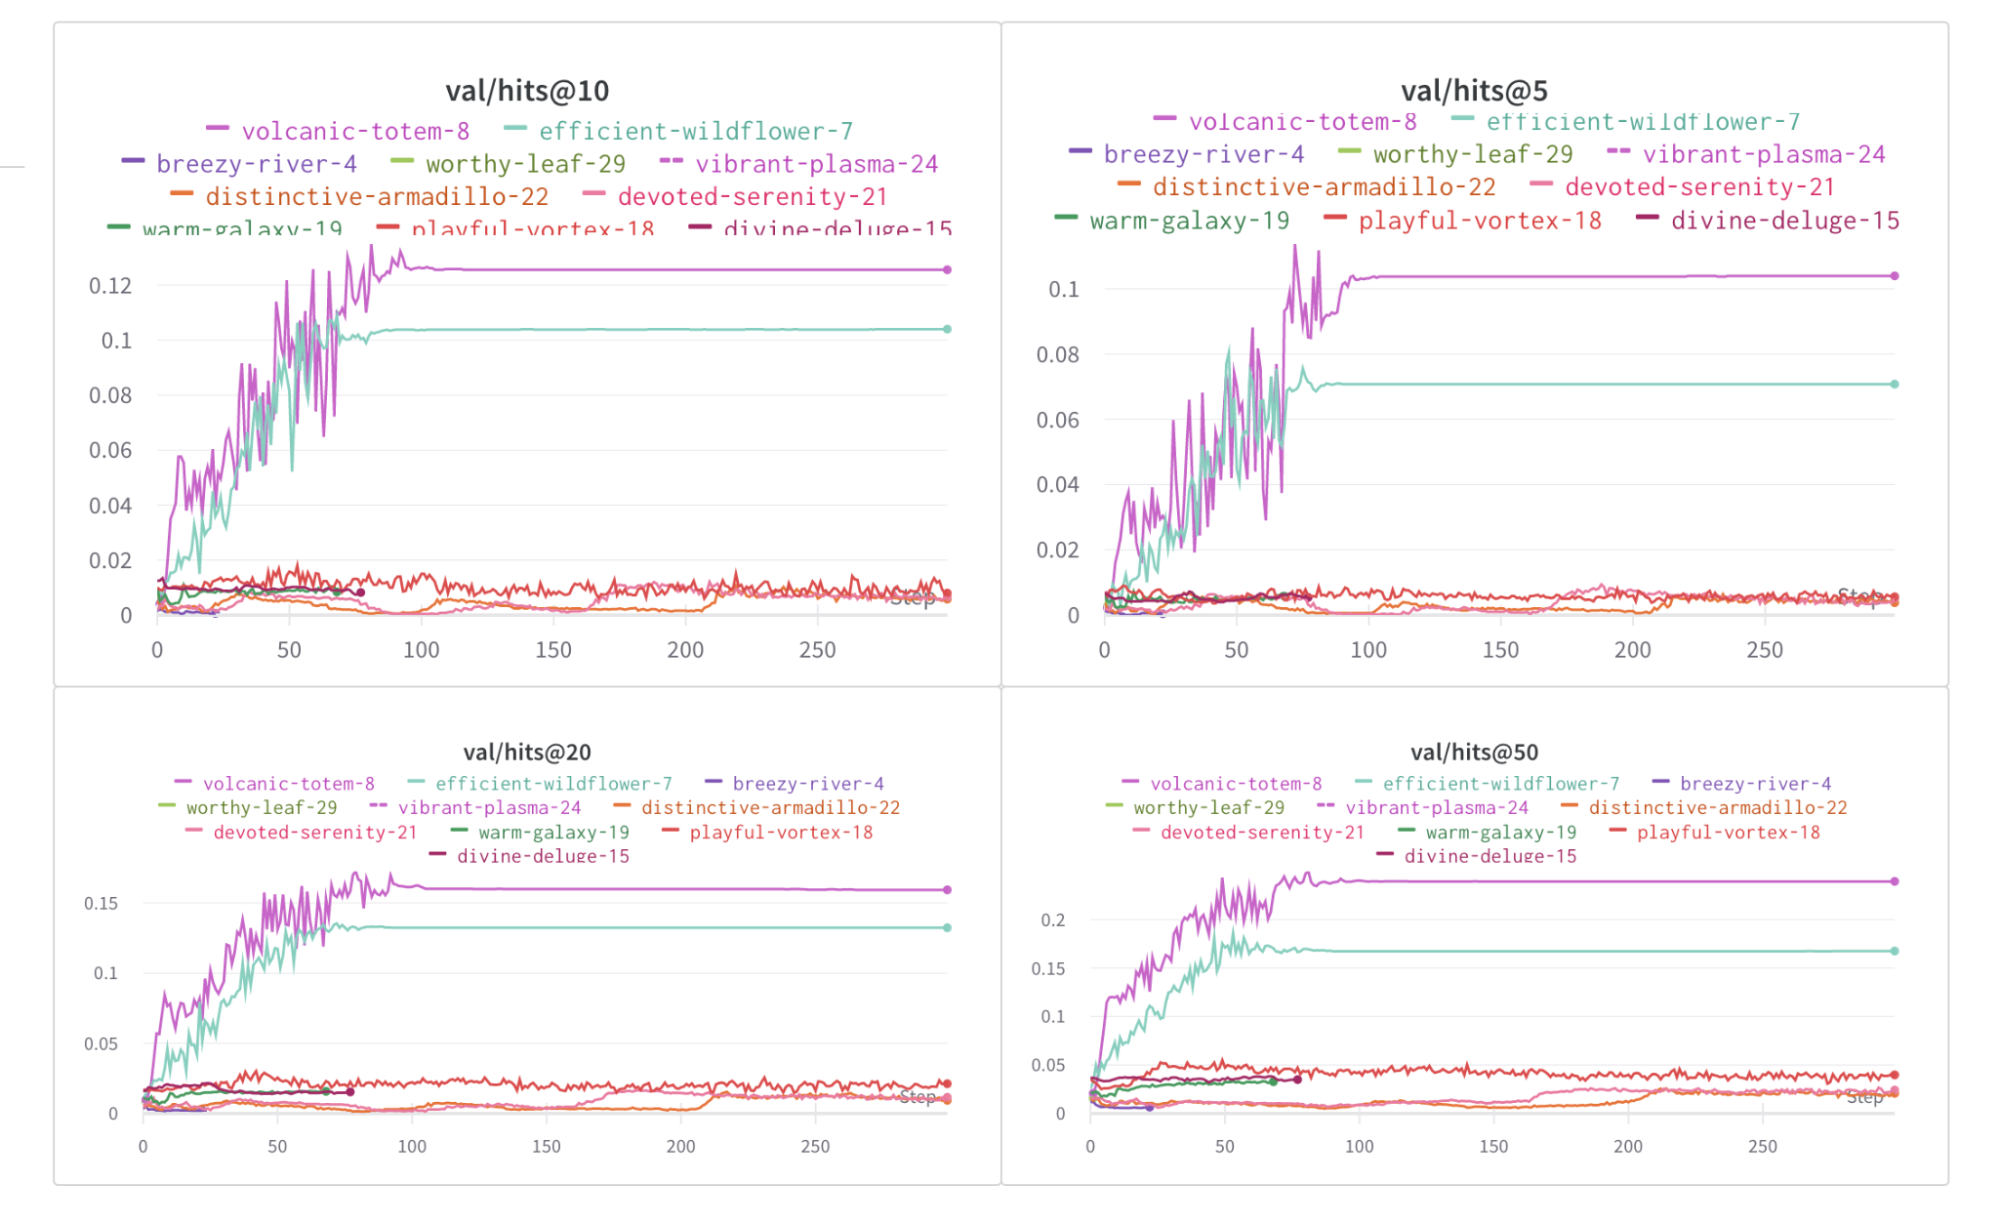
W\&B を使用すると、実験と、損失関数や精度などの関連メトリクスをトラッキングできます。次の行をトレーニングループに追加します。
```python theme={null}
with wandb.init(project="my_project", entity="my_entity") as run:
run.log({
'train/loss': training_loss,
'train/acc': training_acc,
'val/loss': validation_loss,
'val/acc': validation_acc
})
```
## その他のリソース
* [PyTorch Geometricによるグラフニューラルネットワークを用いたAmazon商品の推薦](https://wandb.ai/manan-goel/gnn-recommender/reports/Recommending-Amazon-Products-using-Graph-Neural-Networks-in-PyTorch-Geometric--VmlldzozMTA3MzYw#what-does-the-data-look-like?)
* [PyTorch Geometricによる点群分類](https://wandb.ai/geekyrakshit/pyg-point-cloud/reports/Point-Cloud-Classification-using-PyTorch-Geometric--VmlldzozMTExMTE3)
* [PyTorch Geometricによる点群セグメンテーション](https://wandb.ai/wandb/point-cloud-segmentation/reports/Point-Cloud-Segmentation-using-Dynamic-Graph-CNN--VmlldzozMTk5MDcy)